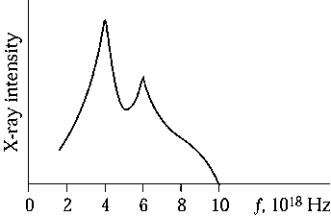
 The graph shows the spectrum of X rays produced by the bombardment of a metal target with high-energy electrons. The maximum kinetic energy of the electrons striking the target is
A) 13.3 * 10-16 J
B) 66.3 *10-16 J
C) 26.5 * 10-16 J
D) 39.8 * 10-16 J
E) 4 *10-18 J
Correct Answer:
Verified
Q85: The limit (n =
Q89: The energy of a quantum of
Q103: The energy of an X-ray photon
Q104: When the voltage across an X-ray tube
Q105: X rays are emitted when the
Q106: For an X-ray tube to produce X
Q109: Evidence of electron capture by a nucleus
Q110: When the voltage across an X-ray tube
Q112: What is the difference in energy
Q127: ![]()
Unlock this Answer For Free Now!
View this answer and more for free by performing one of the following actions

Scan the QR code to install the App and get 2 free unlocks

Unlock quizzes for free by uploading documents