Multiple Choice
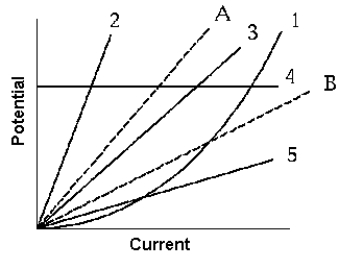 The dashed lines represent graphs of the potential as a function of the current for two resistors A and B, respectively. The curve that might reasonably represent a graph of the data taken when the resistors are connected in series is
A) 1
B) 2
C) 3
D) 4
E) 5
Correct Answer:
Verified
Related Questions

