The following is a relative frequency distribution of grades in an introductory statistics course. 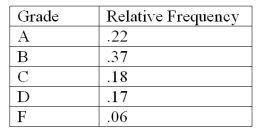 If we wish to depict these data using a pie chart,find how many degrees (out of 360 degrees)should be assigned to each grade.
Correct Answer:
Verified
Q80: The number of weekly sales calls by
Q81: The following is a relative frequency distribution
Q82: Fill in the missing components of the
Q83: The local electronics retailer has recently conducted
Q84: The local electronics retailer has recently conducted
Q85: Recently an advertising company called 200 people
Q89: Math test anxiety can be found throughout
Q90: Recently an advertising company called 200 people
Q105: The number of weekly sales calls by
Q120: The number of weekly sales calls by
Unlock this Answer For Free Now!
View this answer and more for free by performing one of the following actions

Scan the QR code to install the App and get 2 free unlocks

Unlock quizzes for free by uploading documents