The graph of the prediction equation obtained from the model 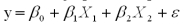 is a(n)
A) Line
B) Plane
C) Parabola
D) Exponential curve
Correct Answer:
Verified
Q32: R2 is defined as:
A)Total variation/explained variation
B)Explained variation/total
Q34: If it is desired to include marital
Q34: A multiple regression analysis with 20 observations
Q36: Consider the following partial computer output for
Q38: The mean square error of a multiple
Q41: _ variation is the sum of explained
Q52: The _ term describes the effects on
Q53: The range of feasible values for the
Q56: Which one of the following is not
Q57: Which of the following residual plots is
Unlock this Answer For Free Now!
View this answer and more for free by performing one of the following actions

Scan the QR code to install the App and get 2 free unlocks

Unlock quizzes for free by uploading documents