For eight randomly selected states,the following table lists the per capita beer consumption (in gallons) and the per capita wine consumption (in gallons) 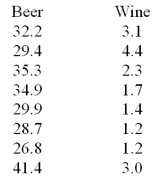
Test H0: ps = 0 vs HA: ps > 0 for the relationship between beer consumption and wine consumption at the state level at = .05.
A) Reject the null hypothesis
B) Fail to reject the null hypothesis
Correct Answer:
Verified
Q87: A study was conducted to investigate the
Q88: A study was conducted to investigate the
Q89: Two coffee-vending machines are studied to determine
Q90: A student is trying to decide if
Q91: Two coffee-vending machines are studied to determine
Q92: A student is trying to decide if
Q94: A student is trying to decide if
Q95: Two coffee-vending machines are studied to determine
Q96: A readability analysis is conducted to determine
Q97: A study was conducted to investigate the
Unlock this Answer For Free Now!
View this answer and more for free by performing one of the following actions

Scan the QR code to install the App and get 2 free unlocks

Unlock quizzes for free by uploading documents