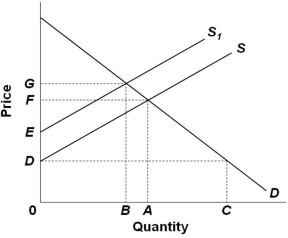
 Refer to the above supply and demand graph. In the graph, line S is the current supply of this product, while line S1 is the optimal supply from the society's perspective. This figure suggests that there is (are) :
A) External benefits from the production of this product
B) External costs in the production of this product
C) Currently an underallocation of resources toward producing this good
D) Positive externalities from producing the good
Correct Answer:
Verified
Q70: Where there are spillover (or external) benefits
Q71: A government is considering undertaking one or
Q72: In a situation where an externality occurs,
Q73: It is the custom for paper mills
Q74: External benefits in consumption refer to benefits
Q76: Which of the following is an example
Q77: When the production of a good generates
Q78: If some activity creates external benefits as
Q79: It is the custom for paper mills
Q80: In a free-market economy, a product which
Unlock this Answer For Free Now!
View this answer and more for free by performing one of the following actions

Scan the QR code to install the App and get 2 free unlocks

Unlock quizzes for free by uploading documents