Refer to the following figure when answering
Figure 9.4: U.S. Inflation 1990-2012 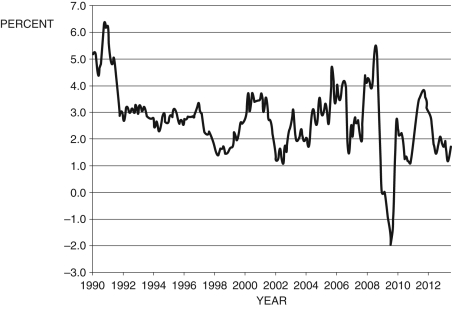
(Source: Bureau of Labor Statistics)
-Consider Figure 9.4, which shows the annual inflation rate. According to the Phillips curve, the period from about 1998 to 2000 was a period of:
A) stagnation
B) recession
C) expansion
D) None of these answers are correct.
E) Not enough information is given.
Correct Answer:
Verified
Q56: Refer to the following figure when
Q58: According to the text, the slope of
Q59: Refer to the following figure when
Q60: According to the text, the slope of
Q62: Refer to the following figure when answering
Q63: In 1979, the inflation rate reached about
Q63: The relationship between actual output in an
Q64: Suppose an economy's natural rate of
Q66: Refer to the following figure when answering
Q80: Taken together, the Phillips curve and Okun's
Unlock this Answer For Free Now!
View this answer and more for free by performing one of the following actions

Scan the QR code to install the App and get 2 free unlocks

Unlock quizzes for free by uploading documents