Refer to the following figure when answering the next five questions.
Figure 9.2: U.S. Output Fluctuations 1960-2012 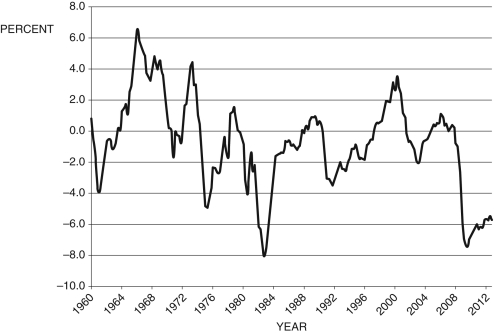
(Source: BEA and CBO, data from Federal Reserve Economic Data, St. Louis Federal Reserve)
-Consider Figure 9.2, which represents . In approximately what years did the U.S. economy experience its longest economic expansion?
A) 1964-1970
B) 1978-1980
C) 1996-2001
D) 1972-1974
E) This cannot be determined from the information given.
Correct Answer:
Verified
Q28: Suppose an economy exhibits a large unexpected
Q30: Refer to the following figure when answering
Q32: Which is responsible for dating business cycles?
A)
Q33: According to the text, which of the
Q37: Refer to the following figure when
Q38: Refer to the following figure when answering
Q39: If current output is
Q40: Refer to the following figure when answering
Q41: The short-run model is built on which
Q46: When the U.S. economy bottomed out during
Unlock this Answer For Free Now!
View this answer and more for free by performing one of the following actions

Scan the QR code to install the App and get 2 free unlocks

Unlock quizzes for free by uploading documents