An oceanographer took readings of the water temperatures C (in degrees Celsius) at several depths d (in meters) .The data collected are shown in the table.
Sketch a scatter plot of the data.
A) 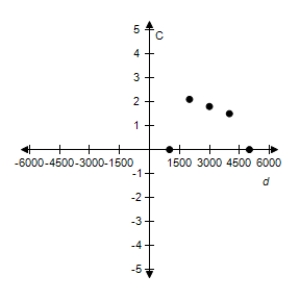
B) 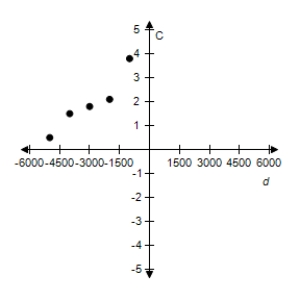
C) 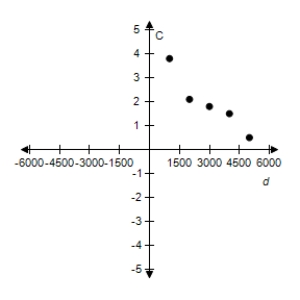
D) 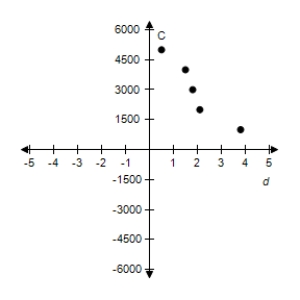
E) 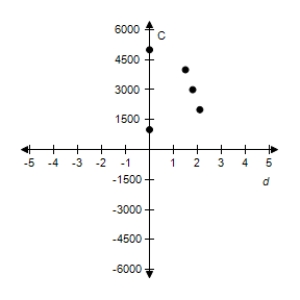
Correct Answer:
Verified
Q30: Use the fact that the resistance of
Q31: Use the given value of k
Q32: Use the given value of k
Q33: Use the given value of k
Q34: Determine whether the variation model is
Q36: Determine whether the variation model is
Q37: Use the given value of k
Q38: Use the given value of k
Q39: Determine whether the variation model is
Q40: Use the given value of k
Unlock this Answer For Free Now!
View this answer and more for free by performing one of the following actions

Scan the QR code to install the App and get 2 free unlocks

Unlock quizzes for free by uploading documents