Use the graph,which shows the average retail prices of 1 gallon of whole milk from 1996 through 2007. 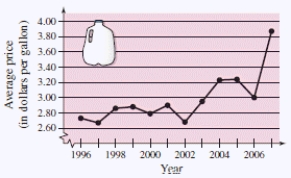 Approximate the percent change in the price of milk from the price in 2000 to the highest price shown in the graph.
A) About 48%
B) About 58%
C) About 43%
D) About 53%
E) About 38%
Correct Answer:
Verified
Q38: Given the points (-6,-8)and (4,-6).Find a third
Q39: Find the distance between the points.(Round the
Q40: Find the distance between the two points
Q41: )Given points(5,-11),and (11,-5)form the vertices of the
Q42: Find the midpoint of the line segment
Q44: The Coca-Cola Company had sales of $19,999
Q45: Find the coordinates of the point that
Q46: A soccer player passes the ball
Q47: Find the coordinates of the vertices of
Q48: The graph shows the numbers of performers
Unlock this Answer For Free Now!
View this answer and more for free by performing one of the following actions

Scan the QR code to install the App and get 2 free unlocks

Unlock quizzes for free by uploading documents