Sketch a scatter plot of the data shown in the table. The table shows the lowest temperature on record y (in degrees Fahrenheit) in Duluth,Minnesota for each month x where x = 1 represents from January.
A) 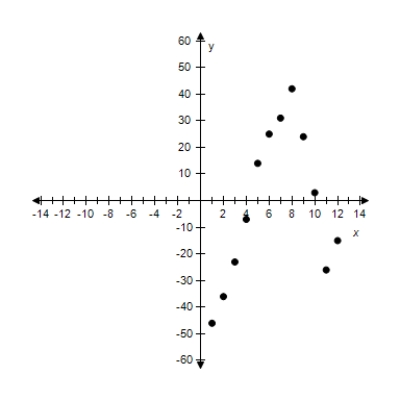 x: Months (1 ? January)
Y: Temperature (in Fº)
B) 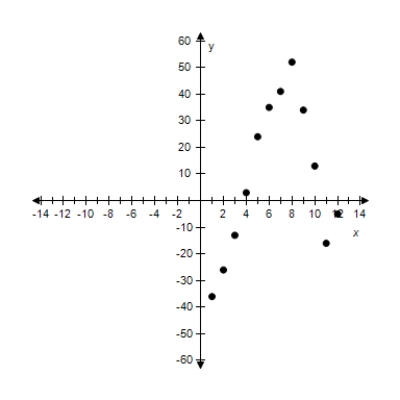 x: Months (1 ? January)
Y: Temperature (in Fº)
C) 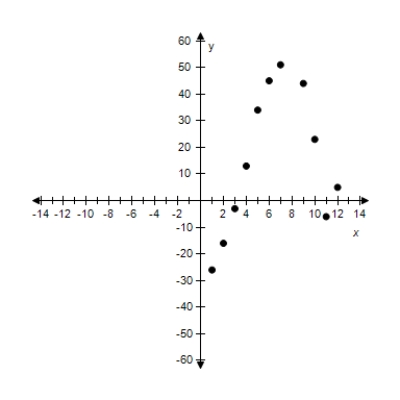 ?
?
X: Months (1 ? January)
Y: Temperature (in Fº)
D) 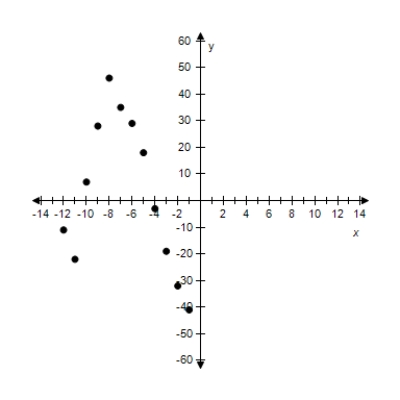 ?
?
X: Months (1 ? January)
Y: Temperature (in Fº)
E) 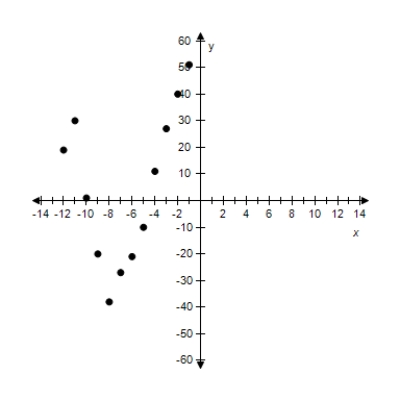 x: Months (1 ? January)
Y: Temperature (in Fº)
Correct Answer:
Verified
Q31: Given points(-1,1),and (-11,-9)form the vertices of the
Q32: Show that the points form the
Q33: Plot the following points and find
Q34: Show that the points form the
Q35: Show that the points form the
Q37: An airplane flies from one city in
Q38: Given the points (-6,-8)and (4,-6).Find a third
Q39: Find the distance between the points.(Round the
Q40: Find the distance between the two points
Q41: )Given points(5,-11),and (11,-5)form the vertices of the
Unlock this Answer For Free Now!
View this answer and more for free by performing one of the following actions

Scan the QR code to install the App and get 2 free unlocks

Unlock quizzes for free by uploading documents