The graph shows the sales (in billions of dollars) for Apple Inc.for the years 2001 through 2007. 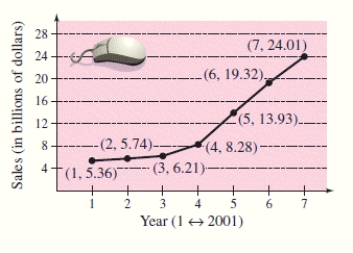 Find the slope of the line segment connecting the points for the years 2003 and 2004.Round the answer to two decimal places.
A) -5.07
B) 2.07
C) 7.07
D) 3.07
E) -2.07
Correct Answer:
Verified
Q19: Find the slope and y-intercept (if
Q20: Find the slope of the line passing
Q21: Determine whether the lines are parallel,perpendicular,or
Q22: Find the slope-intercept form of the
Q23: Use the intercept form to find
Q25: The following is the slope of line
Q26: Use the intercept form to find
Q27: Estimate the slope of the line.
Q28: You are driving on a road
Q29: A sub shop purchases a used
Unlock this Answer For Free Now!
View this answer and more for free by performing one of the following actions

Scan the QR code to install the App and get 2 free unlocks

Unlock quizzes for free by uploading documents