A graph of the force on an object as a function of its position is shown in the figure. Determine the amount of work done by this force on an object that moves from x = 1.0 m to x = 6.0 m. (Assume an accuracy of 2 significant figures for the numbers on the graph.) 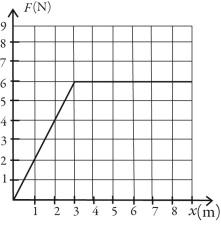
A) 26 J
B) 29 J
C) 22 J
D) 35 J
E) 27 J
Correct Answer:
Verified
Q2: Two men,Joel and Jerry,push against a wall.Jerry
Q9: A 3.00-kg ball swings rapidly in a
Q13: A crane lifts a 425 kg steel
Q17: If a force always acts perpendicular to
Q19: Consider a plot of the displacement (x)as
Q19: Three forces, F1 = 20.0 N, F2
Q20: A stock person at the local grocery
Q20: Two objects, one of mass m and
Q22: How much energy is needed to change
Q32: The coefficient of the restitution of an
Unlock this Answer For Free Now!
View this answer and more for free by performing one of the following actions

Scan the QR code to install the App and get 2 free unlocks

Unlock quizzes for free by uploading documents