Use a graphing utility with the standard viewing window  and
and  to graph the function. Choose the correct graph below.
A) 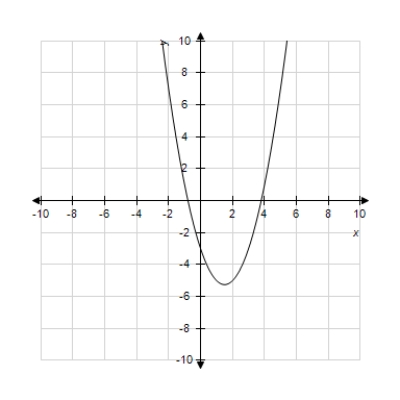
B) 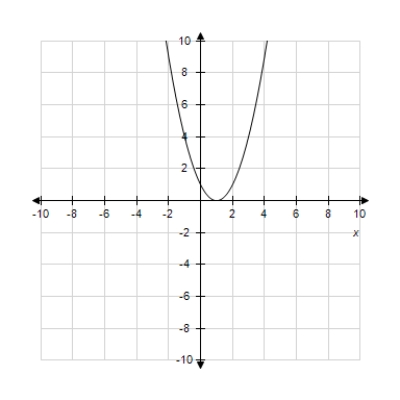
C) 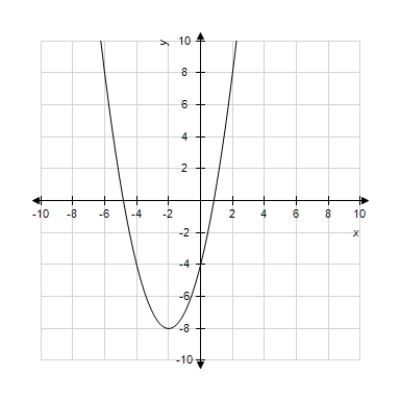
D) 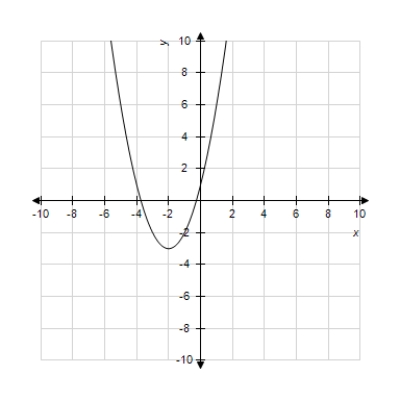
E) 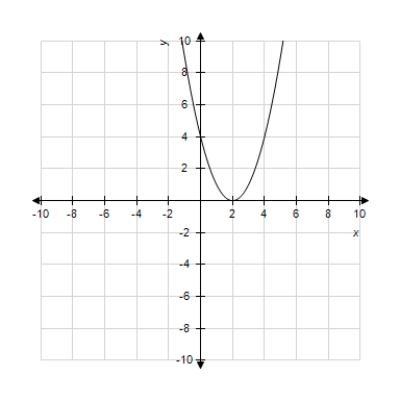
Correct Answer:
Verified
Q125: The percent p of high school seniors
Q126: Suppose the percent of U.S. high school
Q127: Determine whether the following pairs of equations
Q128: Data from 2003 for various groups shows
Q129: Two models for measuring the effects of
Q131: Suppose the cost of a business property
Q132: Using data from the Internal Revenue Service,
Q133: Each day, a young person should sleep
Q134: Determine whether the following pairs of equations
Q135: Write the equation of the line through
Unlock this Answer For Free Now!
View this answer and more for free by performing one of the following actions

Scan the QR code to install the App and get 2 free unlocks

Unlock quizzes for free by uploading documents