The graph below shows the total sales (in thousands of dollars) in a supermarket during a typical 24-hour period. 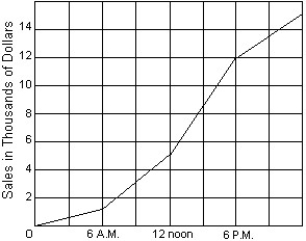 (i) Estimate the rate of sales during the period from 6 A.M. to 12 noon.
(ii) Which 6-hour interval sees the highest rate of sales and what is this rate?
A) (i) $167/hr
(ii) 6pm to 12 noon
B) (i) $1167/hr
(ii) noon to 6pm
C) (i) $667/hr
(ii) 12 noon to 6 pm $1167/hr.
D) none of these
Correct Answer:
Verified
Q92: Which of the following properties are
Q93: Differentiate.
-f(x) = 2
Q94: Use limits to compute f'(5) where
Q95: Use the graph of f to determine
Q96: Let f(x) =
Q98: A company is planning to manufacture
Q99: Let f(x) =
Q100: Differentiate.
-f(x) = 4
Q101: Write the word or phrase that
Q102: Write the word or phrase that
Unlock this Answer For Free Now!
View this answer and more for free by performing one of the following actions

Scan the QR code to install the App and get 2 free unlocks

Unlock quizzes for free by uploading documents