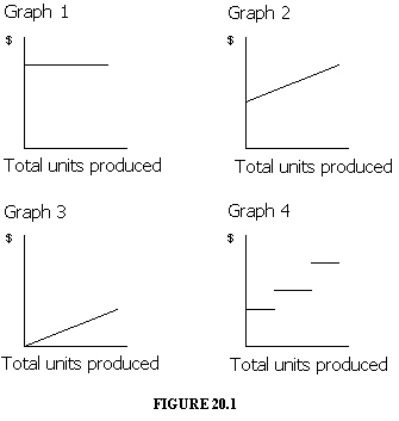
 Which of the graphs in Figure 20-1 illustrates the behavior of a total fixed cost?
A) Graph 2
B) Graph 3
C) Graph 4
D) Graph 1
Correct Answer:
Verified
Q64: Which of the following costs is a
Q65: A cost that has characteristics of both
Q66: Q67: Cost behavior refers to the manner in Q68: For purposes of analysis, mixed costs are Q68: The graph of a variable cost when Q70: Which of the following is NOT an Q70: Costs that vary in total in direct Q71: Which of the following activity bases would Q73: Which of the following describes the behavior![]()
Unlock this Answer For Free Now!
View this answer and more for free by performing one of the following actions

Scan the QR code to install the App and get 2 free unlocks

Unlock quizzes for free by uploading documents