Figure 27-1.The figure shows a utility function. 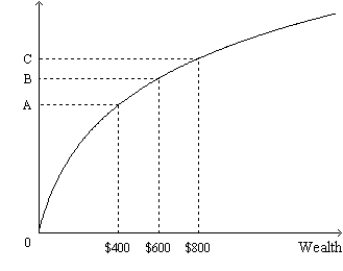
-Refer to Figure 27-1.Let 0A represent the distance between the origin and point A;let AB represent the distance between point A and point B;etc.Which of the following ratios best represents the marginal utility per dollar when wealth increases from $400 to $600?
A) 
B) 
C) 
D) 
Correct Answer:
Verified
Q7: Risk aversion helps to explain various things
Q8: Figure 27-2.The figure shows a utility function
Q9: Figure 27-1.The figure shows a utility function.
Q11: If Joanna is risk averse,then
A)her utility function
Q12: Figure 27-2.The figure shows a utility function
Q14: For a risk averse person,
A)the pleasure of
Q15: Figure 27-1.The figure shows a utility function.
Q16: Economists have developed models of risk aversion
Q17: Figure 27-2.The figure shows a utility function
Q18: Figure 27-2.The figure shows a utility function
Unlock this Answer For Free Now!
View this answer and more for free by performing one of the following actions

Scan the QR code to install the App and get 2 free unlocks

Unlock quizzes for free by uploading documents