Refer to the graph. 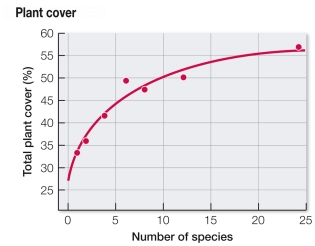 According to the graph, which statement best describes the relationship between total plant cover (a measure of productivity) and number of species (species richness) in test plots?
A) Greater species richness is associated with lower productivity.
B) Greater species richness is associated with greater productivity.
C) Productivity and species richness do not appear to show a relationship.
D) Productivity remains relatively high regardless of total plant cover.
E) Productivity increases when species richness is low but decreases when it is high.
Correct Answer:
Verified
Q206: After a volcanic eruption, weathering, rain, and
Q207: Students comparing insect communities in two fields
Q208: A rancher wants to ensure that her
Q209: A wetland is drained, filled, and planted
Q210: During succession at Glacier Bay, Dryas and
Q212: Scientists are still experimenting to better understand
Q213: A small fish species is accidentally introduced
Q214: During secondary succession, detritivores and decomposers are
Q215: Suppose succession occurred in a situation like
Q216: During the process of succession, early species
Unlock this Answer For Free Now!
View this answer and more for free by performing one of the following actions

Scan the QR code to install the App and get 2 free unlocks

Unlock quizzes for free by uploading documents