The graphs illustrate elk and aspen numbers over several decades in Yellowstone National Park.They show major human management actions (removal and return of wolves; hunting of elk).Given this information, describe how biotic factors affected the community structure of Yellowstone National Park during this century.List each biotic factor and its effect. 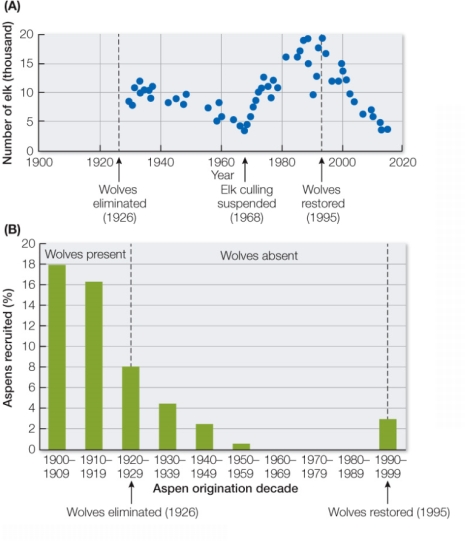
Correct Answer:
Verified
View Answer
Unlock this answer now
Get Access to more Verified Answers free of charge
Q126: The eruption of Mount St.Helens in 1980
Q127: The text shows a large, complex area
Q128: Seagrass beds extend along much of the
Q129: Competition is an important interaction in most
Q130: A person trying to define an ecological
Q132: Three species of kangaroo rats and five
Q133: Approximately once every century, a coastal region
Q134: The diagram illustrates the intermediate disturbance hypothesis,
Q135: During secondary succession following habitat destruction of
Q136: The Burmese python is native to tropical
Unlock this Answer For Free Now!
View this answer and more for free by performing one of the following actions

Scan the QR code to install the App and get 2 free unlocks

Unlock quizzes for free by uploading documents