Refer to the graph below. 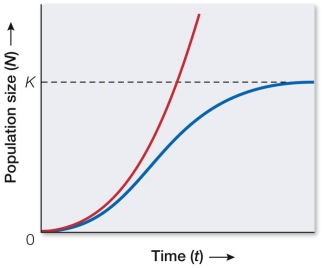 The size of a deer population in an enclosed, protected area was measured over several years and found to be following the red (left) growth curve shown.After several years of drought, its population size more closely followed the blue (right) curve.What factor probably caused the change in the deer's population growth?
A) Emigration
B) Immigration
C) Genetic alterations
D) Food or water limitations
E) A flood or hurricane
Correct Answer:
Verified
Q46: Refer to the graph below. 
Q47: In the logistic population growth curve shown
Q48: Refer to the paragraph below.
The African
Q49: Climate change is altering many aspects of
Q50: All of the populations described below would
Q52: The African wild dog is highly endangered
Q53: Consider the logistic growth equation shown:
Q54: As populations of giant clams in the
Q55: The logistic growth equation describes a population
Q56: A population is at its carrying capacity
Unlock this Answer For Free Now!
View this answer and more for free by performing one of the following actions

Scan the QR code to install the App and get 2 free unlocks

Unlock quizzes for free by uploading documents