Refer to the graph showing how different types of organisms respond to changes in environmental temperature. 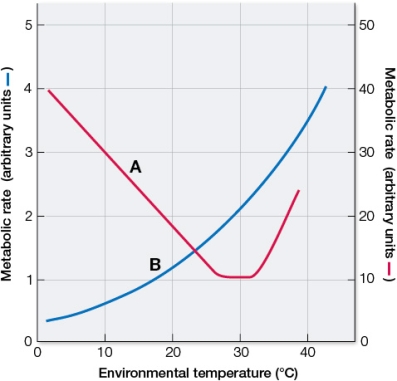 One of these curves represents a lizard, and the other represents a mouse.Which curve corresponds to which animal? At what environmental temperatures are the metabolic rates of the lizard the highest and the lowest? At what environmental temperatures are the metabolic rates of the mouse the highest and the lowest?
Correct Answer:
Verified
View Answer
Unlock this answer now
Get Access to more Verified Answers free of charge
Q135: Refer to the graph showing body temperature
Q136: Which statement about glial cells is true?
A)
Q137: Refer to the graph. Q138: The metabolic rate of an organism is Q139: How does seasonal acclimatization affect an animal's Q141: The thermal limits for most functions in Q142: Stratified squamous epithelium Q143: Which statement is true? Q144: Effectors Q145: Which statement is true?![]()
A) is made up of
A) Extracellular fluid consists
A) provide feedback information for comparison with
A) At temperatures below
Unlock this Answer For Free Now!
View this answer and more for free by performing one of the following actions

Scan the QR code to install the App and get 2 free unlocks

Unlock quizzes for free by uploading documents