Figure: Value of Uses 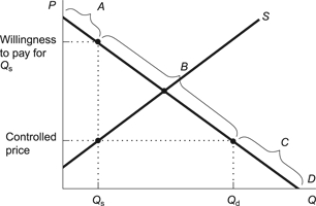 The sections labeled A, B, and C represent, respectively, the:
A) highest-valued uses, lower-valued uses, least-valued uses.
B) highest-valued uses, least-valued uses, lower- valued uses.
C) least-valued uses, lower-valued uses, highest-value uses
D) lower-valued uses, highest-valued uses, least-valued uses.
Correct Answer:
Verified
Q105: Use the following to answer questions:
Figure: Price
Q106: Use the following to answer questions:
Figure: Price
Q107: Use the following to answer questions:
Figure: Price
Q108: Which events occurred during the 1973-1974 oil
Q109: Use the following to answer questions:
Figure: Price
Q111: Use the following to answer questions:
Figure: Price
Q112: Which of the following best represents the
Q113: During the energy crisis of the 1970s,
Q114: Economists blame the long lines at gasoline
Q115: Use the following to answer questions:
Figure: Price
Unlock this Answer For Free Now!
View this answer and more for free by performing one of the following actions

Scan the QR code to install the App and get 2 free unlocks

Unlock quizzes for free by uploading documents