Figure 13-4 shows the short-run macroeconomic equilibrium of an economy at Point A. In the figure, Point A suggests that:Figure 13-4 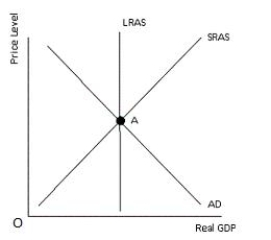
A) the economy is running a balance of payment deficit.
B) there is a surplus of money in the economy.
C) the economy is operating at long-run equilibrium.
D) prices are falling in the economy.
E) there is a low level of unemployment in the economy.
Correct Answer:
Verified
Q84: Figure 13-5 shows the short-run macroeconomic equilibrium
Q85: Figure 13-10 shows the short-run macroeconomic equilibrium
Q86: Figure 13-8 shows the short-run macroeconomic equilibrium
Q87: The aggregate demand curve portrays the relationship
Q90: What happens to aggregate demand if the
Q91: Why do increases in input prices impact
Q93: Figure 13-6 shows the short-run macroeconomic equilibrium
Q94: Figure 13-9 shows the short-run macroeconomic equilibrium
Q197: Explain how changes in the stock of
Q200: Explain why the short-run supply curve is
Unlock this Answer For Free Now!
View this answer and more for free by performing one of the following actions

Scan the QR code to install the App and get 2 free unlocks

Unlock quizzes for free by uploading documents