Graph A below shows an elastic demand curve, and Graph B shows an inelastic demand curve. Graph B shows that as the price decreases from $20 to $10, total revenue _____ and quantity demanded _____.Figure 4.1: 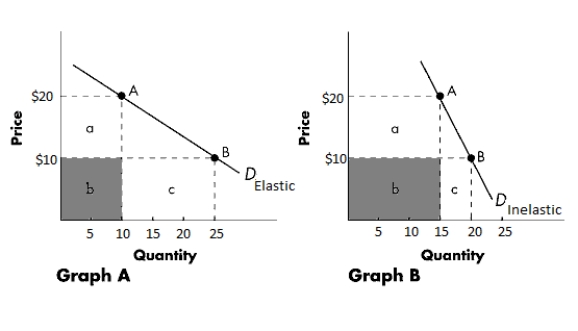
A) decreases; increases
B) decreases; decreases
C) increases; increases
D) increases; decreases
E) remains unchanged; remains unchanged
Correct Answer:
Verified
Q69: When the demand for a good is
Q70: The Book Nook reduces prices by 20
Q71: When a binding price floor is imposed
Q72: If a price floor imposes a binding
Q73: If the supply curve of a good
Q75: A "war on drugs" is waged, and,
Q76: Lydia enjoys going to the theater to
Q77: Suppose a government imposes a binding price
Q78: If the elasticity of supply coefficient equals
Q79: If the supply curve of a good
Unlock this Answer For Free Now!
View this answer and more for free by performing one of the following actions

Scan the QR code to install the App and get 2 free unlocks

Unlock quizzes for free by uploading documents