Using the figure below,which of the following best describes the titration curve? 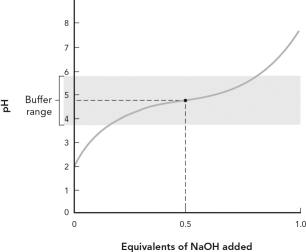
A) The equivalence point for the titration is pH = 7.
B) The midpoint of the titration is pH = 7.
C) The pKa for this weak acid is 4.76.
D) This is a titration of a weak base by NaOH.
Correct Answer:
Verified
Q62: A solution of which of the following
Q63: Compare the reaction conditions for 
Q64: You wish to prepare a solution with
Q65: The main function of the chloroplast is
A)
Q66: Differentiate between autotrophs and heterotrophs.
Q68: Calculate the pH of a solution containing
Q69: Compare the reaction conditions under which you
Unlock this Answer For Free Now!
View this answer and more for free by performing one of the following actions

Scan the QR code to install the App and get 2 free unlocks

Unlock quizzes for free by uploading documents