The following graph shows the demand and supply curves of a resource. The equilibrium amount of the resource exchanged in the market is _____. Figure 11.4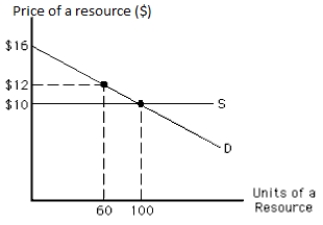
A) more than 100 units
B) 100 units
C) 60 units
D) less than 60 units
E) between 60 and 100 units
Correct Answer:
Verified
Q81: The more elastic the supply of a
Q86: Economic rent is _
A)the opportunity cost of
Q91: Suppose ten pretzels are sold at a
Q94: The following graph shows the demand and
Q97: The following graph shows the demand and
Q98: The following graph shows the demand and
Q99: The following graph shows the demand and
Q100: The following graph shows the demand and
Q107: A resource's marginal product is
A)the revenue produced
Q112: If 14 workers produce a total of
Unlock this Answer For Free Now!
View this answer and more for free by performing one of the following actions

Scan the QR code to install the App and get 2 free unlocks

Unlock quizzes for free by uploading documents