Figure 5.7 shows four demand curves. The demand curve that best illustrates how consumers will respond to a change in price over a very long time period is: Figure 5.7
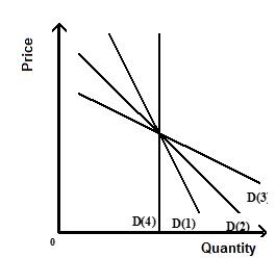
A) curve D(1) .
B) curve D(2) .
C) curve D(4) .
D) curve D(3) .
E) curve D(1) or curve D(4) .
Correct Answer:
Verified
Q114: If price increases from $45 to $55,
Q114: A good that takes up a very
Q115: Which of the following goods will have
Q120: All other things constant, if a _
Q123: Figure 5.10 shows two upward-sloping linear supply
Q146: One determinant of the price elasticity of
Q151: The supply of a product will be
Q160: If the price elasticity of supply in
Q172: The value of the cross-price elasticity of
Q190: If the income elasticity of demand for
Unlock this Answer For Free Now!
View this answer and more for free by performing one of the following actions

Scan the QR code to install the App and get 2 free unlocks

Unlock quizzes for free by uploading documents