Multiple Choice
Figure 6-1 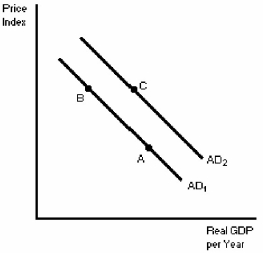
-In Figure 6-1,a movement from point B to point C could be explained by
A) an increase in the price level.
B) a decrease in the price level.
C) the start of a short-term war.
D) the real-balance effect.
Correct Answer:
Verified
Related Questions
Q19: Other things constant,the economy's aggregate demand curve
Q20: The long-run aggregate supply curve
A)is horizontal.
B)indicates the
Q21: If you have $1 000 and the
Q22: According to the interest rate effect,an increase
Q23: An increase in the price level
A)increases the
Unlock this Answer For Free Now!
View this answer and more for free by performing one of the following actions

Scan the QR code to install the App and get 2 free unlocks

Unlock quizzes for free by uploading documents