From the following scatter plot,we can say that between y and x there is _______. 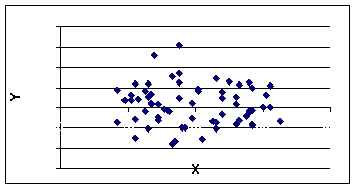
A) perfect positive correlation
B) virtually no correlation
C) positive correlation
D) negative correlation
E) perfect negative correlation
Correct Answer:
Verified
Q22: Regression output from Excel software directly shows
Q28: A t-test is used to determine whether
Q29: From the following scatter plot,we can say
Q30: According to the following graphic,X and Y
Q35: According to the following graphic,X and Y
Q36: Regression output from Minitab software directly displays
Q38: Regression methods can be pursued to estimate
Q38: The F-value to test the overall significance
Q40: The variability in the estimated slope is
Q49: If there is perfect negative correlation between
Unlock this Answer For Free Now!
View this answer and more for free by performing one of the following actions

Scan the QR code to install the App and get 2 free unlocks

Unlock quizzes for free by uploading documents