The table below shows the velocities, in feet per second, of a ball that is thrown horizontally from the top of a 50 foot building and the distances, in feet, that it lands from the base of the building.Compute the linear regression equation for these data. 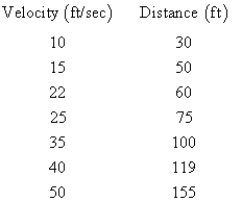
A) 
B) 
C) 
D) 
E) 
Correct Answer:
Verified
Q17: After completing the table, use the resulting
Q18: Plot the points and find the slope
Q19: Sketch the graph of the equation below.
Q20: Match the equation below with its graph.
Q21: After opening the parachute, the descent of
Q23: Find the slope of the line that
Q24: Use the point on the line and
Q25: Determine if lines Q26: Determine whether lines L1 and L2 passing Q27: Determine whether lines L1 and L2 passing![]()
Unlock this Answer For Free Now!
View this answer and more for free by performing one of the following actions

Scan the QR code to install the App and get 2 free unlocks

Unlock quizzes for free by uploading documents