Using a graph,explain both the substitution effect and income effect that result from an increase in the price of a normal good.
B.
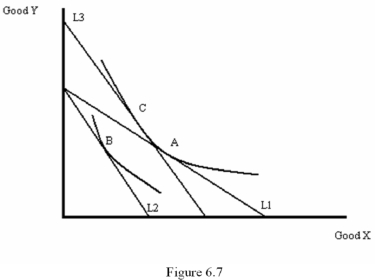
C. The income effect is then shown by the movement from point C to point
Correct Answer:
Verified
View Answer
Unlock this answer now
Get Access to more Verified Answers free of charge
Q46: Q47: A demand curve that shows the relationship Q48: Q49: Suppose that an individual has chosen not Q52: Because individuals initially own more time than Q53: Which of the following best describes labour Q54: If a good is inferior,then whenever the Q55: For a normal good,the income and substitution Q56: For low wages,the labour supply curve slopes Q60: What is the difference between approximate and![]()
![]()
Unlock this Answer For Free Now!
View this answer and more for free by performing one of the following actions

Scan the QR code to install the App and get 2 free unlocks

Unlock quizzes for free by uploading documents