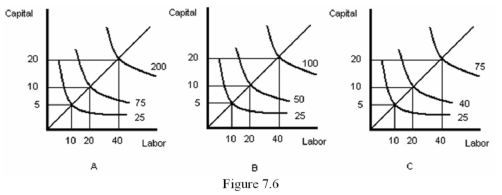
-Refer to Figure 7.6.Which graph represents decreasing returns to scale?
A) A
B) B
C) C
D) Both graph A and graph C
Correct Answer:
Verified
Q55: Returns to scale is a _ concept
Q56: Consider the Cobb-Douglas production function F(L,K)= ALaKb.Which
Q57: If technological change is factor neutral,then the
Q58: For the Cobb-Douglas production function F(L,K)= ALaKb,a
Q59: The Cobb-Douglas production function F(L,K)= ALaKbwill exhibit
Q62: Suppose you mange a firm with two
Q63: Suppose a firm uses both labour (L)and
Q63: Define decreasing returns to scale,illustrating your definition
Q64: Consider the production function Q = F(L,K)=
Q65: Consider the Cobb-Douglas production function F(L,K)= ALaKb.Suppose
Unlock this Answer For Free Now!
View this answer and more for free by performing one of the following actions

Scan the QR code to install the App and get 2 free unlocks

Unlock quizzes for free by uploading documents