Multiple Choice
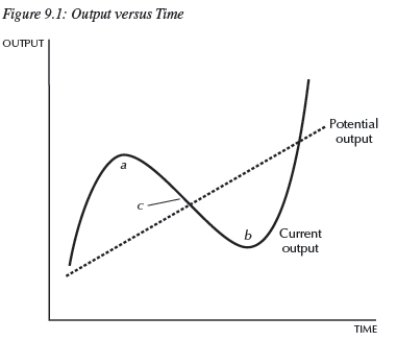
-Consider Figure 9.1.The dashed line is potential output and the solid line is current output;therefore,
A) areas a and b are booms.
B) area b represents an economic boom,and area a is a recession.
C) the economy is in neither a recession nor a boom in areas a and b.
D) area a represents an economic boom,and area b is a recession.
Correct Answer:
Verified
Related Questions

