The figure given below shows the average fixed cost (AFC) and the average variable cost (AVC) curves of a competitive firm.Figure 8.1
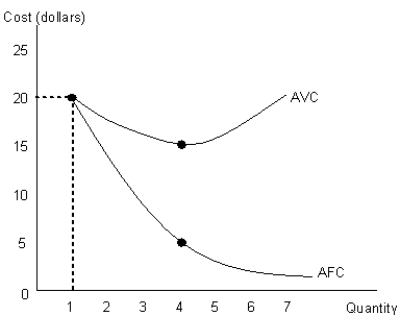
-Using Figure 8.1 determine the average total cost of producing the first unit of the output.
A) $10
B) $20
C) $30
D) $40
E) $50
Correct Answer:
Verified
Q20: The below figure shows the various combinations
Q21: The figure given below shows cost curves
Q22: The below figure shows the various combinations
Q23: The below figure shows the various combinations
Q24: The figure given below shows cost curves
Q26: The figure given below shows cost curves
Q27: The following table shows the cost of
Q28: The following table shows the cost of
Q29: The following table shows the cost of
Q30: The following table shows the cost of
Unlock this Answer For Free Now!
View this answer and more for free by performing one of the following actions

Scan the QR code to install the App and get 2 free unlocks

Unlock quizzes for free by uploading documents