The figure given below depicts short-run equilibrium in an aggregate demand-aggregate supply model.If the economy is at point "e" in the short run,which of these policies adopted by the Fed is likely to return it to long-run equilibrium?
Figure 15.3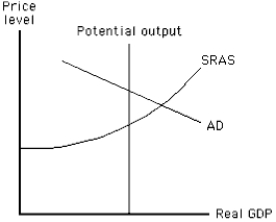
A) A decrease in government spending
B) An increase in the tax rate
C) A decrease in the tax rate
D) A decrease in the money supply
E) An increase in the money supply
Correct Answer:
Verified
Q53: The demand curve for investment depicts:
A)an inverse
Q62: For monetary policy to be effective in
Q63: An increase in the money supply leads
Q67: Identify the correct statement about changes in
Q71: If the Fed sells U.S.government securities to
Q72: If the Fed adopts a contractionary monetary
Q73: Given an upward sloping aggregate supply curve,which
Q77: Monetary policy will be effective in changing
Q80: The ultimate effect of a reduction in
Q82: The figure given below depicts short-run equilibrium
Unlock this Answer For Free Now!
View this answer and more for free by performing one of the following actions

Scan the QR code to install the App and get 2 free unlocks

Unlock quizzes for free by uploading documents