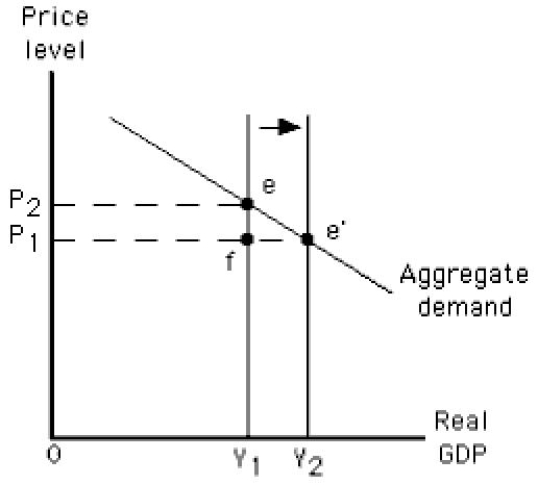
The figure given below depicts long run equilibrium in an aggregate demand-aggregate supply model.Which of the following is indicated by the arrow given in this figure?
Figure 10.8
A) A decrease in capital stock
B) An increase in long-run aggregate supply
C) An increase in nominal wage
D) A decrease in long-run aggregate supply
E) A decrease in the aggregate quantity demanded
Correct Answer:
Verified
Q87: Which of these is an advantage of
Q98: A recessionary gap develops:
A)when actual output exceeds
Q105: Which of the following supply shocks will
Q112: An economy's potential level of output can
Q114: The capital stock of an economy increases:
A)whenever
Q117: Given the aggregate demand curve,a beneficial supply
Q118: In the long run,a leftward shift of
Q119: Which of these is not a beneficial
Q120: Which of the following is most likely
Q128: The figure given below depicts long run
Unlock this Answer For Free Now!
View this answer and more for free by performing one of the following actions

Scan the QR code to install the App and get 2 free unlocks

Unlock quizzes for free by uploading documents