The figure below shows equilibrium in an aggregate demand-aggregate supply model.The shift from AS to AS' in this figure represents a(n) :
Figure 10.3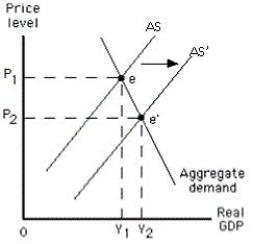
A) increase in short-run aggregate supply.
B) increase in long-run aggregate supply.
C) decrease in short-run aggregate supply.
D) decrease in long-run aggregate supply.
E) decrease in the aggregate quantity demanded.
Correct Answer:
Verified
Q39: Which of the following is true if
Q48: An expansionary gap in the short-run results
Q60: In the short run,there is a positive
Q64: Which of the following occurs when an
Q79: The figure below shows the short-run aggregate
Q83: The figure below shows the short-run aggregate
Q84: The figure below shows equilibrium in an
Q85: The figure below shows the short-run aggregate
Q86: The figure below shows the short-run aggregate
Q87: The figure below shows equilibrium in an
Unlock this Answer For Free Now!
View this answer and more for free by performing one of the following actions

Scan the QR code to install the App and get 2 free unlocks

Unlock quizzes for free by uploading documents