The movement from point A to point B in the figure below illustrates the effect of:
Figure 8.1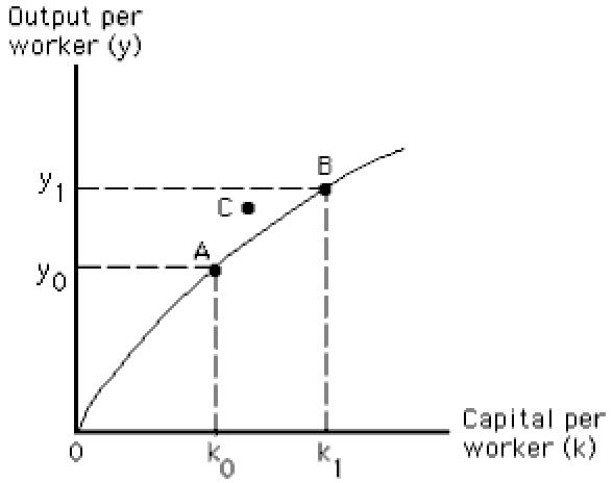
A) an increase in the capital stock relative to the workforce.
B) an increase in the labor productivity growth rate.
C) an increase in labor productivity because of higher quality capital.
D) a decrease in labor productivity.
E) a decrease in the capital stock.
Correct Answer:
Verified
Q22: Which of the following implies a decline
Q24: A point on the per-worker production function
Q26: Which of the following factors of production
Q29: If a nation moves upward along its
Q30: If increases in capital per worker lead
Q38: A decrease in the capital-labor ratio would
Q40: The per-worker production function illustrates the fact
Q51: An increase in the quantity of capital
Q60: Which of the following is assumed to
Q76: The figure below shows three different per-worker
Unlock this Answer For Free Now!
View this answer and more for free by performing one of the following actions

Scan the QR code to install the App and get 2 free unlocks

Unlock quizzes for free by uploading documents