An object starts its motion with a constant velocity of 2.0 m/s toward the east.After 3.0 s,the object stops for 1.0 s.The object then moves toward the west a distance of 2.0 m in 3.0 s.The object continues traveling in the same direction,but increases its speed by 1.0 m/s for the next 2.0 s.Which graph below could represent the motion of this object?
A) 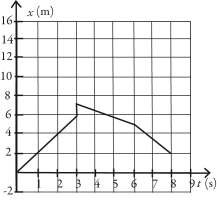
B) 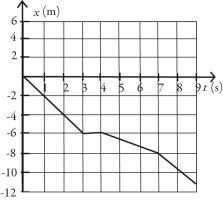
C) 
D) 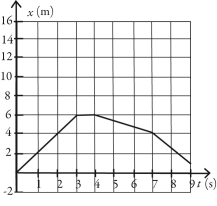
Correct Answer:
Verified
Q24: Arthur and Betty start walking toward each
Q32: If the fastest you can safely drive
Q43: Approximately how many pennies would you have
Q43: Approximately how many times does an average
Q47: The height of the ceiling in a
Q48: The motion of a particle is described
Q54: The figure shows a graph of the
Q55: A cat runs along a straight line
Q56: The figure shows the graph of the
Q94: Estimate the number of times the earth
Unlock this Answer For Free Now!
View this answer and more for free by performing one of the following actions

Scan the QR code to install the App and get 2 free unlocks

Unlock quizzes for free by uploading documents