A graph of the force on an object as a function of its position is shown in the figure.Determine the amount of work done by this force on the object during a displacement from  to
to  .(Assume an accuracy of 3 significant figures for the numbers on the graph.)
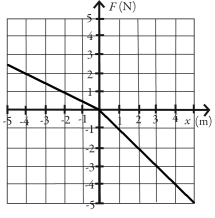
A) -12.0 J
B) -3.00 J
C) -1.00 J
D) 12.0 J
E) 3.00 J
Correct Answer:
Verified
Q21: A person pushes horizontally on a heavy
Q22: In the figure,two identical springs have unstretched
Q23: A constant horizontal pull acts on a
Q24: A force on a particle depends on
Q25: Block A (0.40 kg)and block B (0.30
Q27: In the figure,two identical ideal massless springs
Unlock this Answer For Free Now!
View this answer and more for free by performing one of the following actions

Scan the QR code to install the App and get 2 free unlocks

Unlock quizzes for free by uploading documents