This graph of expected sales level and expected output shows: 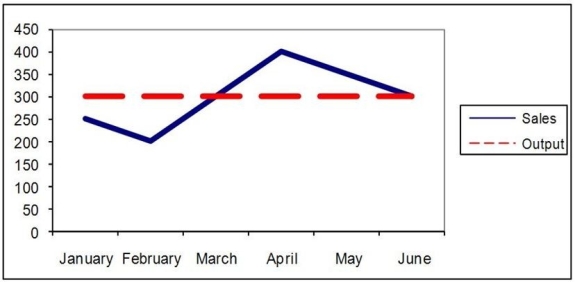
A) a chase production plan is being used.
B) a level production plan is being used.
C) a mixed production plan is being used.
D) planning levels have been computed.
Correct Answer:
Verified
Q28: The alternative production strategies of level, chase,
Q29: It costs $12 to make a
Q30: It costs $10 to make a
Q31: A company has the cost structure
Q32: Last month a firm made 100 model
Q34: Planning values are used in bottom-up planning,
Q35: Seventy percent of a house painter's business
Q36: The standard equation used by Gigi Enterprises
Q37: Regular production costs $13 per unit
Q38: A company has the cost structure
Unlock this Answer For Free Now!
View this answer and more for free by performing one of the following actions

Scan the QR code to install the App and get 2 free unlocks

Unlock quizzes for free by uploading documents