The figure shows a graph of the power dissipated in a resistor as a function of the resistance. What quantity does the slope of this graph represent? 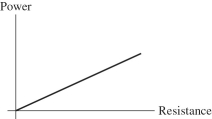
A) the current in the resistor
B) the potential difference across the resistor
C) the reciprocal of the current in the resistor
D) the square of the current in the resistor
E) the resistivity of the resistor
Correct Answer:
Verified
Q22: When the current through a resistor is
Q25: If we double the resistance in a
Q26: If the voltage across a circuit of
Q30: Consider two copper wires with circular
Q31: Consider two copper wires of equal cross-sectional
Q34: If a quantity you calculated has
Q36: The length of a certain wire is
Q37: Consider two copper wires of equal cross-sectional
Q38: Consider two copper wires of equal length.One
Q40: During a period of high power demand,the
Unlock this Answer For Free Now!
View this answer and more for free by performing one of the following actions

Scan the QR code to install the App and get 2 free unlocks

Unlock quizzes for free by uploading documents