The figure shows a graph of the position of a moving object as a function of time.
(a) What is the average velocity of the object from t = 0 s to t = 4.0 s?
(b) What is the average velocity of the object from t = 0 s to t = 6.0 s? 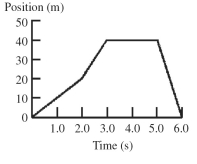
Correct Answer:
Verified
View Answer
Unlock this answer now
Get Access to more Verified Answers free of charge
Q164: The figure shows the velocity-versus-time graph for
Q165: The figure shows a graph of the
Q166: The graph in the figure shows the
Q167: The figure shows a graph of the
Q168: The figure shows a graph of the
Q169: The graph in the figure shows the
Q171: The graph in the figure shows the
Q172: The figure shows a graph of the
Q173: The graph in the figure shows the
Q174: The graph in the figure shows the
Unlock this Answer For Free Now!
View this answer and more for free by performing one of the following actions

Scan the QR code to install the App and get 2 free unlocks

Unlock quizzes for free by uploading documents