Essay
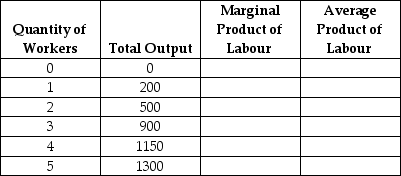
Fill in the missing values in the following table. Draw one graph showing how total output increases with the quantity of workers hired, and another graph showing the marginal product of labour and the average product of labour.
Correct Answer:
Verified
Related Questions
Q126: What is the marginal product of labour
Q132: If a firm experiences diminishing returns its
Q133: Which of the following costs will not
Q133: If production displays increasing marginal returns, then
A)total
Unlock this Answer For Free Now!
View this answer and more for free by performing one of the following actions

Scan the QR code to install the App and get 2 free unlocks

Unlock quizzes for free by uploading documents