In the following table, 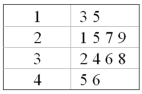
A) The median is 2.5.
B) The minimum value is 135.
C) The maximum value is 456.
D) The range is 33.
Correct Answer:
Verified
Q50: The following graph illustrates _. 
Q51: A sample of experienced typists revealed that
Q52: Using the following statistics to describe a
Q53: The median of a sample will always
Q54: A contingency table would be used to
Q56: In a contingency table, we describe the
Q57: In a scatter diagram, we describe the
Q58: The range of the coefficient of skewness
Q59: A stem-and-leaf display includes the following row:
Q59: A large oil company is studying the
Unlock this Answer For Free Now!
View this answer and more for free by performing one of the following actions

Scan the QR code to install the App and get 2 free unlocks

Unlock quizzes for free by uploading documents