Which of the following graphs illustrates the behavior of a total fixed cost within the specified relevant range? 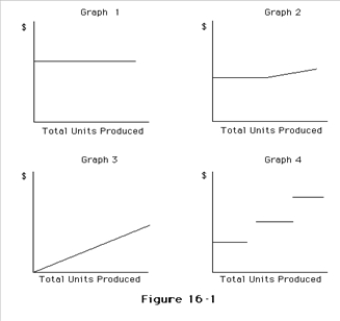
A) Graph 2
B) Graph 3
C) Graph 4
D) Graph 1
Correct Answer:
Verified
Q43: A low operating leverage is normal for
Q46: Costs that remain constant on a per-unit
Q48: If a business sells two products, it
Q49: Cost-volume-profit analysis can be presented in both
Q50: If the volume of sales is $6,000,000
Q50: Which of the following costs is an
Q51: If fixed costs are $450,000 and the
Q54: If the volume of sales is $6,000,000
Q60: Only a single line, which represents the
Q60: If the unit selling price is $40,
Unlock this Answer For Free Now!
View this answer and more for free by performing one of the following actions

Scan the QR code to install the App and get 2 free unlocks

Unlock quizzes for free by uploading documents