The following plot shows two titration curves,each representing the titration of 50.00 mL of 0.100 M acid with 0.100 M NaOH. 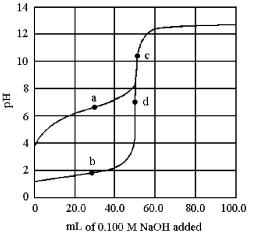
-Which points a-d represent the half-equivalence point and the equivalence point,respectively,for the titration of a weak acid?
A) points a and b
B) points a and c
C) points b and d
D) points c and d
Correct Answer:
Verified
Q79: The following pictures represent solutions that contain
Q80: Which metal sulfides can be precipitated from
Q81: The following plot shows two titration curves,each
Q82: The following plot shows two titration curves,each
Q83: Use the graphs below to answer the
Q85: The following pictures represent solutions at various
Q86: The following pictures represent solutions that contain
Q87: The following pictures represent solutions at various
Q88: The following pictures represent solutions at various
Q89: The following plot shows two titration curves,each
Unlock this Answer For Free Now!
View this answer and more for free by performing one of the following actions

Scan the QR code to install the App and get 2 free unlocks

Unlock quizzes for free by uploading documents