Electrostatic potential maps use color to portray the calculated electron distribution in a molecule.Atoms that are electron poor and carry a δ+ charge are shown in blue.Atoms that are electron rich and carry a δ- charge are shown in red.Atoms with little or no charge are shown in green.The electrostatic potential map of H2O below should show 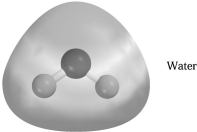
A) H blue and O red.
B) H blue and O green.
C) H green and O blue.
D) H red and O blue.
Correct Answer:
Verified
Q113: Which best indicates the direction of the
Q114: Which drawing best represents hydrogen bonding?
Q115: Which drawing below best represents hydrogen bonding
Q116: Which drawing best accounts for the polarity
Q117: A molecular model of SO42- is shown
Q119: A molecular model of NO3- is shown
Q120: Which drawing best represents hydrogen bonding in
Q121: Which drawing represents a π bonding molecular
Q122: Which drawing represents the lowest energy unoccupied
Q123: Which of the following best describes ICl2-?
Unlock this Answer For Free Now!
View this answer and more for free by performing one of the following actions

Scan the QR code to install the App and get 2 free unlocks

Unlock quizzes for free by uploading documents