Shown below are the histogram and summary statistics for the reading scores of 29 fifth graders. 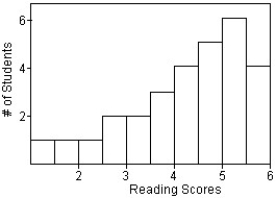

Which measures of centre and spread would you use for this distribution?
A) Mean and standard deviation,because the data is symmetric.
B) Median and IQR,because the data is skewed to the left.
C) Mean and standard deviation,because the data is skewed to the left.
D) Mean and IQR,because the data is skewed to the left.
E) Median and standard deviation,because the data is skewed to the left.
Correct Answer:
Verified
Q20: The back-to-back stem-and-leaf display compares the percent
Q21: The weekly salaries (in dollars)of 24 randomly
Q22: The weekly salaries (in dollars)of sixteen government
Q23: Here is the stem-and-leaf display of the
Q24: Here are boxplots of the points scored
Q26: The boxplots display case prices (in dollars)of
Q27: The weekly salaries (in dollars)of 24 randomly
Q28: Office workers were asked how long it
Q29: The boxplots display case prices (in dollars)of
Q30: The times,in minutes,it took for 21 students
Unlock this Answer For Free Now!
View this answer and more for free by performing one of the following actions

Scan the QR code to install the App and get 2 free unlocks

Unlock quizzes for free by uploading documents