Shown below are the boxplot and the histogram for the weights (in pounds) of 30 newborn babies in the U.S.A.. 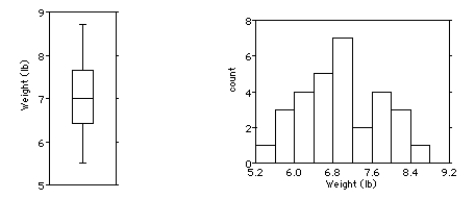
i.What features of the distribution can you see in both the histogram and the boxplot?
ii.What features of the distribution can you see in the histogram that you could not see in the boxplot?
A) i) The distribution is bimodal and symmetric.There are two outliers at about 5.4 and 8.6.The mean and median values are about the same.
ii.The dip at about 7.4 lb,for example,is apparent only from the histogram.
B) i) The distribution is unimodal and skewed to the right.There are no outliers.The mean is greater than the median.
ii.The dip at about 7.4 lb,for example,is apparent only from the histogram.
C) i) The distribution is unimodal and symmetric.There are two outliers at about 5.4 and 8.6.The mean and median values are about the same.
ii.The dip at about 7.4 lb,for example,is apparent only from the histogram.
D) i) The distribution is unimodal and skewed to the left.There are no outliers.The mean is less than the median.
ii.The dip at about 7.4 lb,for example,is apparent only from the histogram.
E) i) The distribution is unimodal and symmetric.There are no outliers.The mean and median values are about the same.
ii.The dip at about 7.4 lb,for example,is apparent only from the histogram.
Correct Answer:
Verified
Q5: For which class are the mean and
Q6: The centre for health in a certain
Q7: The histograms display the body fat percentages
Q8: The back-to-back stem-and-leaf display compares the annual
Q10: Match each class with the corresponding boxplot
Q14: Shown below are the boxplot and the
Q15: Describe what these boxplots tell you about
Q16: Which class had the smallest standard deviation?
A)Class
Q16: Do men and women run a 5-kilometre
Q19: Which class had the smallest IQR?
A)Class 1,because
Unlock this Answer For Free Now!
View this answer and more for free by performing one of the following actions

Scan the QR code to install the App and get 2 free unlocks

Unlock quizzes for free by uploading documents